The 10-Year Treasury Yield Topped 5.15% That Day, the Highest Since 2007, and Everyone Said Stocks Were Finally Done For — Yet the Dow Fell Just 0.3% and the S&P and Nasdaq Barely Moved. What Scares Money Off Is Never How Much the Rate Rose. It Is Whether a Growth Story Can Outrun It!
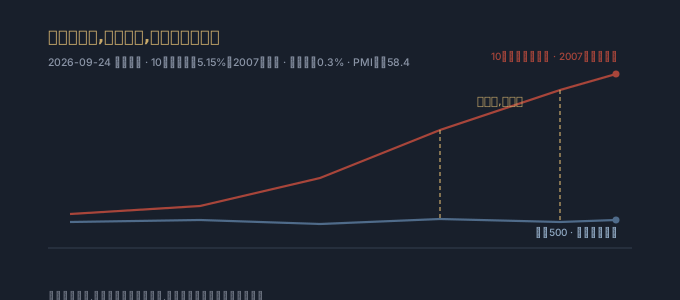
Two days running, the loudest line in financial media has been the same: Treasury yields have climbed this far, so stocks are finally done for. The logic sounds airtight — the interest rate is the discount rate, and when the discount rate rises, future cash flows get converted back to today’s dollars at a harsher discount, so stock prices should shrink to match. It’s a way of welding price and rate onto a single axis: rate is the input, price is the output, and once the function is set, the two are supposed to move in lockstep, panic included.
Thursday, September 24 (US Eastern) — early Friday in Beijing — the close bent that axis out of shape. The 10-year Treasury yield broke above 5.15% that day, its highest level since 2007 — translated into plain terms, the last time it cost this much to borrow money for ten years, Alan Greenspan was still running the Fed. The 30-year yield reset to its highest since 2004, on the same day — the last time thirty-year borrowing cost this much, George W. Bush hadn’t finished his first term. By the textbook math, this should have been the day the stock market flinched. Instead the Dow closed down just 0.3%, barely more than rounding error. The S&P 500 and the Nasdaq barely moved at all — the whole day’s range was thin enough to look like the market hadn’t really opened.
Pull the day’s ledger apart and the trigger for the selloff turns out to be specific. The flash September composite PMI came in at 58.4 that day, the strongest reading in more than five years — 50 is the line between expansion and contraction, so 58.4 means the business owners who felt things were expanding that month badly outnumbered the ones who felt things were shrinking. The bond market read that number one way: the economy is running hot, the Fed is likely to hike again in October, sell the bonds, send the yield higher. The stock market read the exact same 58.4 and drew the opposite conclusion: orders and earnings are expanding in that same hot economy too. Fundamentally, neither ledger got the arithmetic wrong. The two were never trying to compute the same thing — bonds and stocks went their separate ways that day. What scares off any given ledger is never how much the rate rose. It’s whether that ledger has a growth story that can outrun it.
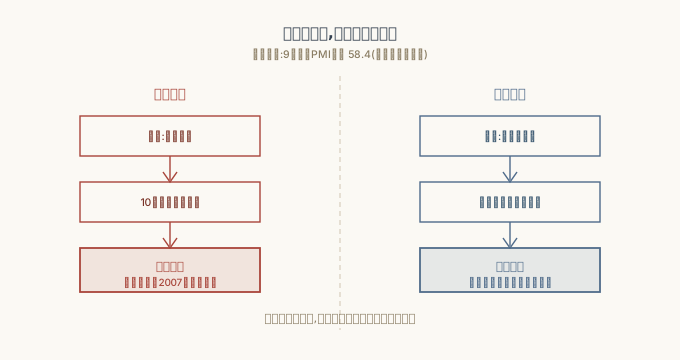
Run that logic in reverse and it gets sharper. Nudge the discount rate up an inch, and whatever has no earnings underneath it — whatever was only surviving on cheap money — should be the first thing to show its true shape, and the worse for it. But whatever already has earnings growth accelerating gets that same inch of discount absorbed by the slope of its own growth, and then some. The names posting quarterly numbers this stretch — Nvidia, Broadcom, Micron — have been turning in revenue growth in the double digits, sometimes the triple digits. Set a growth rate like that against a few dozen basis points of rate move, and the numerator is rising faster than the denominator. Flip the scenario: the same yield spike landing on an economy where corporate earnings growth was actually slowing down — that day would not have looked like a flat market. It would have looked like stocks getting dragged down with the bonds. What’s rising was never the same “rate” for every asset. What’s rising is the slope of growth standing on the other side of it, and how steep that slope is.
The yield curve itself hasn’t even been a straight line. Less than a week ago, the 10-year was pulling back from an earlier high this month toward roughly 4.9%, and plenty of people exhaled. A few days later it turned right back around, dragging the 30-year up to a fresh high alongside it. The rate traced a full V inside one week — and stocks never traced that V back. If price really were a function of the rate, the V should have shown up on the stock side too. It didn’t. The same day, crypto didn’t flinch either: spot bitcoin ETFs extended a sixth straight day of net inflows, pulling in more than $2.8 billion over that run. The money kept moving in quietly, day after day, with no sign of turning around. That’s not bitcoin being unusually brave. It’s that whatever this money is computing was never the bond ledger to begin with.
Fundamentally, there is no central authority computing risk appetite on behalf of every asset at once. The bond market that day was pricing what it costs to lend money to an economy running hotter on inflation. The stock market was pricing whether an economy with orders and earnings expanding in lockstep deserved today’s price. Crypto wasn’t even running on the same channel as either of the other two. Three ledgers, fed the same headline on the same day, each honestly computed three answers that had nothing to do with each other — and that is what spontaneous order actually looks like. No single command gets every ledger to copy the same answer. Each ledger only answers to the slope of its own growth.
What scares money off was never the rate. It was money with no growth standing underneath it.
SECURE PAYMENT VIA STRIPE
Subscribe: $50 annual pass unlocks every paid article on this site for one year
Go deeper: Ko-fi members get a weekly members-only deep dive, from $3/month Become a member →